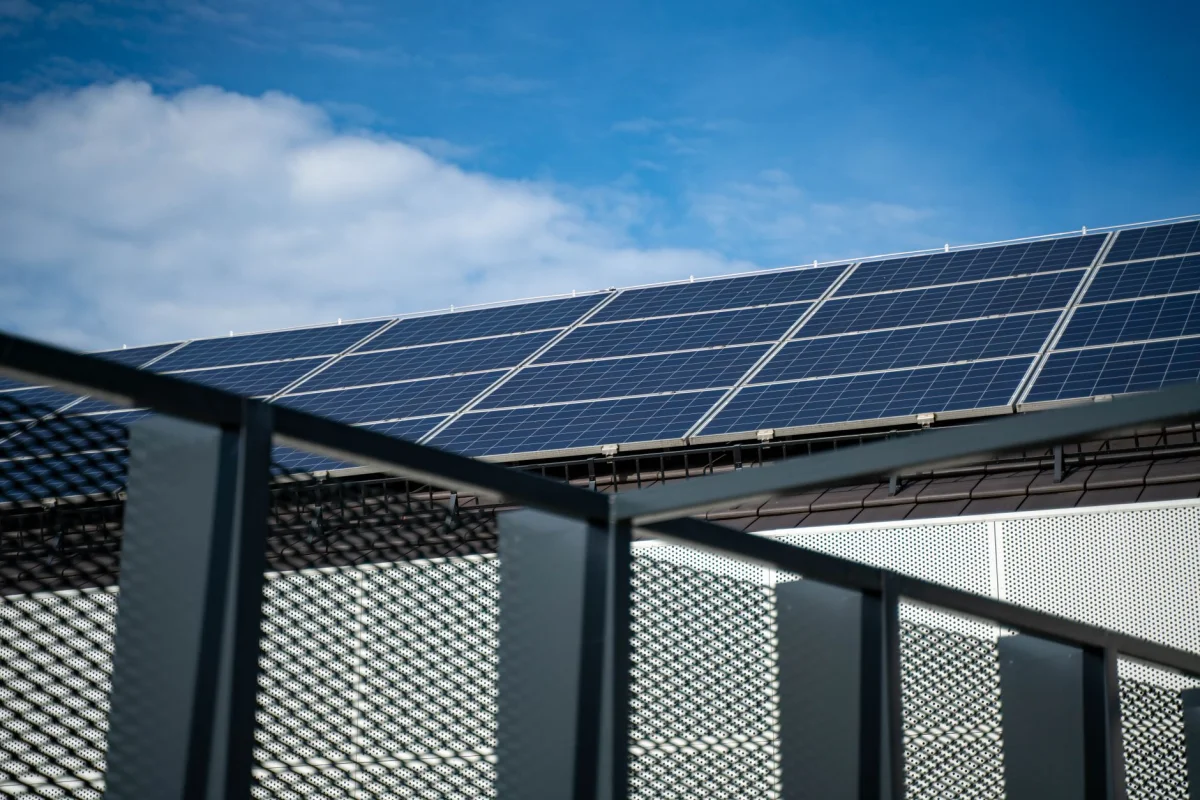
Every solar sales pitch comes with a savings number, and almost none of them explain where that number came from. Ask an installer to walk through the assumptions behind a quoted payback period and you'll often get a shrug, or a spreadsheet that leans hard on best-case sun hours and skips over the details that actually swing the math. A solar savings calculator run with your own numbers, not a sales rep's optimistic defaults, is the only way to know what you're really looking at.
That doesn't mean any number a calculator spits out is automatically trustworthy. The tool is only as good as what goes into it, and there are a handful of inputs that quietly determine whether the output is close to reality or closer to marketing.
How a Solar Savings Calculator Actually Works
At its core, the calculation is simple: estimated system cost, minus incentives, divided by estimated annual savings, gives you a rough payback period in years. The complexity hides in each of those three pieces. System cost depends on how many panels you need, which depends on your usage and roof space. Incentives depend on where you live and what's currently available. Annual savings depend on your actual electricity rate and how much of your usage the system offsets.
A calculator that just asks for your zip code and monthly bill and spits out a confident-looking number is skipping most of that nuance. A better one asks for your actual electricity bill, your roof's usable square footage, and your location specifically because those three numbers move the output more than anything else does.
What Determines Your System Cost After the Federal Tax Credit
The federal residential clean energy credit currently knocks a meaningful percentage off the gross cost of a solar installation, and it's the single biggest factor separating the sticker price an installer quotes from what you'll actually pay. What trips people up is applying the credit to the wrong number, some installers quote pre-incentive pricing prominently and bury the post-credit figure, or vice versa, which makes comparing two quotes side by side harder than it should be.
Local and utility-specific incentives stack on top of the federal credit in some areas and don't exist at all in others, which is exactly why a generic national average savings figure is close to meaningless for any specific address. Details on the federal credit itself are maintained by the Department of Energy, and it's worth checking the current terms directly rather than trusting a number an installer quoted you six months ago, since credit terms and phase-out schedules do change.
Roof Condition and Sun Exposure: The Variables Most Estimates Skip
 Photo by Budget Bizar on Pexels
A roof that needs replacing in three years is a bad candidate for a twenty-five-year solar investment, since removing and reinstalling panels for a roof job adds real cost that a quick online estimate never accounts for. Before running serious savings numbers, get an honest read on remaining roof life, not just from the installer who wants to sell you panels, but from a source with no stake in whether you say yes.
Shading matters just as much and gets skipped even more often. A roof that looks sunny from the street can still lose a meaningful chunk of daily output to a tree canopy, a chimney, or a neighboring structure at certain times of day and certain seasons. Panels rated for a specific output under ideal, unshaded conditions will underperform that number by however much shade actually falls across the array, and the gap between "rated output" and "actual output" is exactly where an inflated savings estimate comes from.
Reading Your Current Electric Bill Correctly Before You Run the Numbers
Your current monthly bill isn't a single flat number for calculation purposes, it's a rate structure. Some utilities bill a flat rate per kilowatt-hour. Others use tiered rates that climb the more you use, or time-of-use rates that charge more during peak afternoon and evening hours. Which structure your utility uses changes how much a solar system actually saves you, since offsetting expensive peak-hour usage is worth more than offsetting cheap off-peak usage even if the raw kilowatt-hour count is identical.
Pull an actual utility bill and look for the rate structure printed on it, or check your utility's rate schedule directly, rather than estimating your average rate from memory. A savings estimate built on a guessed rate that's off by even a few cents per kilowatt-hour compounds into a meaningfully wrong payback period over a twenty-five-year projection.
Calculating the Real Payback Period, Not the Marketing Number
 Photo by Airam Dato-on on Pexels
The payback period marketing materials quote is often simple division: total cost after incentives, divided by year-one savings. That number ignores that electricity rates historically trend upward over time, which means your savings in year fifteen are likely to be larger than your savings in year one, shortening the real payback period compared to a flat, year-one-only calculation.
It also often ignores financing costs if you didn't pay cash, panel degradation, which is real but modest, typically under half a percent of output lost per year, and any maintenance costs over the system's life. None of these individually move the number by much, but stacked together they're the difference between a marketing brochure's optimistic number and what actually shows up in your utility bills over the following decade.
Financing Options and How They Change Your Actual Savings
 Photo by Pixabay on Pexels
Paying cash, taking a solar-specific loan, and financing through a home equity line each produce a different real payback period even for the identical system, because the interest cost eats into what would otherwise be pure savings. A home equity line often carries a lower rate than a dedicated solar loan, but it also puts your house up as collateral, which is a real tradeoff worth thinking through rather than defaulting to whichever financing option the installer's in-house lending partner offers first.
Before signing anything, it's worth comparing at least two financing paths side by side using your actual numbers, not the installer's example scenario built around a system size and interest rate that may not match what you're actually getting. The Consumer Financial Protection Bureau publishes general guidance on comparing home financing offers that applies directly here, even though it isn't solar-specific.
Net Metering and Why Your Utility's Policy Matters as Much as Your Panels
Net metering, the arrangement where excess solar production gets credited against your usage at other times, varies enormously by utility and state, and it has a bigger effect on your actual savings than most people realize going in. A utility that credits excess production at the full retail rate makes solar meaningfully more valuable than one that credits it at a lower wholesale rate, even for two houses with identical panels and identical sun exposure.
Some utilities are actively reducing net metering credit rates for new solar customers as adoption grows, which means the deal available to a neighbor who installed panels three years ago may not be the deal available to you today. Wikipedia's overview of net metering explains the mechanism in more depth, but the specific rate your utility currently offers is something you have to check directly, since it changes faster than most general references can track.
Common Mistakes That Make Solar Savings Estimates Wrong
The most common mistake is using a national average sun-hours figure instead of a number specific to your actual location and roof orientation, which can be off by a large enough margin to meaningfully change a payback estimate. A south-facing roof in a sunny climate and a north-facing roof under partial shade in a cloudier region are not the same input, even if a quick calculator defaults them to a similar regional average.
The second most common mistake is ignoring your own usage pattern entirely. A household that uses most of its electricity in the evening, after solar production has dropped off for the day, saves less from the same system than a household with usage concentrated during daylight hours, unless battery storage is part of the equation. Skipping this detail is how two neighbors with identical systems end up with noticeably different real-world savings.
A third mistake worth naming is trusting a single installer's software output as if it were an independent estimate. Every installer's tool is tuned to make their own proposal look favorable, which isn't necessarily dishonest, but it does mean the assumptions baked in favor whatever system size and financing plan they're already trying to sell you. Cross-checking against your own independent calculation, using panel efficiency figures from a source like NREL's research data, catches the cases where a quote's numbers are quietly optimistic rather than just rounded.
Environmental Impact Numbers: What CO2 Offset Calculations Actually Mean
 Photo by William Gevorg Urban on Pexels
Alongside the dollar figures, a lot of solar estimates include an environmental impact number, typically framed as equivalent trees planted or cars taken off the road. These figures come from converting your estimated offset electricity generation into an equivalent carbon reduction using regional grid emissions data, since the actual carbon intensity of the electricity you'd otherwise be buying varies significantly by region depending on the local utility's generation mix.
That regional variation matters more than it might seem. A solar system in a region where the grid already runs mostly on hydro or nuclear power offsets less carbon per kilowatt-hour than an identical system in a region still running largely on coal, even though the dollar savings could be nearly identical in both cases. The Solar Energy Industries Association tracks broader industry and adoption data if you want context beyond a single household's estimate.
Putting the Numbers Together Before You Talk to an Installer
Running your own numbers before the first sales call changes the conversation entirely. Instead of reacting to whatever payback period an installer's software generates from their own assumptions, you show up with a baseline built from your actual electric bill, your roof's real condition, and your specific utility's net metering policy, and you can immediately tell when a quote's numbers are optimistic relative to your own estimate.
That baseline also makes it easier to spot the difference between two quotes that look similar on paper but rest on very different assumptions about your roof's usable space, your local incentive stack, or how many peak sun hours your specific address actually gets. A number you calculated yourself, from your own bill and your own roof, is a far better anchor for that comparison than a number handed to you by whoever is trying to close the sale.
The free Solar Savings Calculator from EvvyTools walks through system cost after the federal tax credit, monthly and 25-year savings, payback period, and environmental impact using your own electricity bill, roof size, and location rather than a generic regional default. Check the tools directory for related calculators covering home equity and renovation ROI, or browse the blog hub for more breakdowns like this one, and start at the EvvyTools homepage if you're comparing this against other home improvement financing decisions.